Before creating a Power Writer report, it is important to have a clear idea of what your report will achieve. For example, is this report a Profit & Loss statement, Balance Sheet, Job Performance Analysis, a detail report or a summary report?
To create a basic Cost Report which is a Job Costing report.
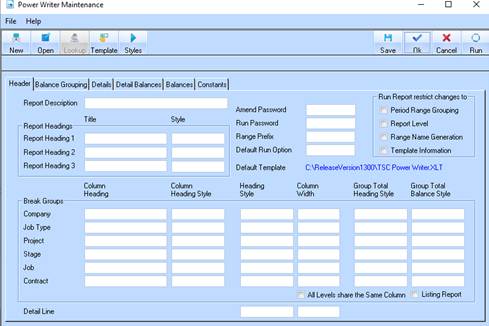
1. Select the New Report button. The following window will be displayed:
2. The Header tab allows you to specify the report template, the heading for the report, the layout of the report, the Excel styles that are to be used in the report.
|
|
The Excel Template shipped with Power Writer will have a series of styles set up for use by Power Writer. These styles can then be specified in the Power Writer report creation so that the report will be generated with formatting in place, and time is not wasted by having to format the report. Once the Template is chosen, you can click on the Styles button, to obtain the styles to use in the Power Writer Report |
3. Select the Template button. The following window will be displayed:
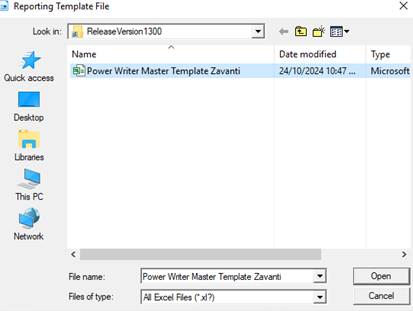
4. Select the relevant file and press the Open button.
5. Select the Styles button. The system will import the styles for the report based on your file selection. You will note that the message bar will display processing text and your mouse pointer will display as an hour glass meaning that the system is processing your request.
6. Upon completion, enter a value into the Report Description field for example, “Job Performance Analysis”. Position your cursor into the Report Heading 1 field.
7. In the Report Heading 1 field, enter a title for the report. Press Tab.
8. In the Style field select the Lookup button. The following window will be displayed:
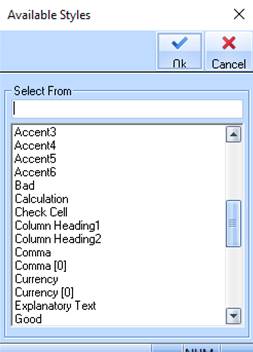
9. Select a Style from the list and press the OK button.
10. In the Break Groups box selections allow you to itemise the break levels of Company, Job Type, Job and Contract. You can enter heading styles here so that these will be formatted for you.
11. Ensure that
the All Levels Share the Same Column checkbox  is selected. This instructs the system to
align the report to the left hand side of the spreadsheet.
is selected. This instructs the system to
align the report to the left hand side of the spreadsheet.
12. The Miscellaneous box allows you to choose to specify a password for this report. You can specify a password to open the report and a password to amend.
13. As with all outputs to Excel you can specify a detail style in the Detail Line text box. This means that the detail rows of the report will be in the format specified.
14. Select the Balance Grouping tab. The following window will be displayed:
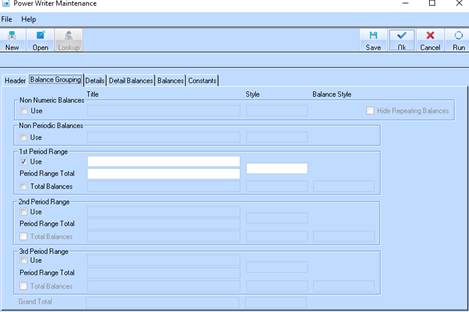
15. The Balance Grouping tab allows you to specify how many period ranges you would like in the report.
16. You can have one period range per output area. For example if you would like to compare actual balances with forecast balances, you can have two period ranges. For the first period range you would choose the actual dates, and for the forecast period range you would choose the forecast dates. You can have up to 3 numeric period ranges, one non-numeric period range (to extract data like stage or estate name) and non-period ranges, where you specify a non-periodic balance.
17. For this example, we will create 1 period range. This will allow us to report on ‘Up To’ data. The Balance Grouping tab determines how many period ranges you will use in the report.
|
|
You must have a tick in the period range box in the Balance Grouping tab, to be able to access balances for those periods in the Balances tab. |
18. Select the
1st Period Range Use checkbox.
19. Select the
2nd Period Range Use checkbox .
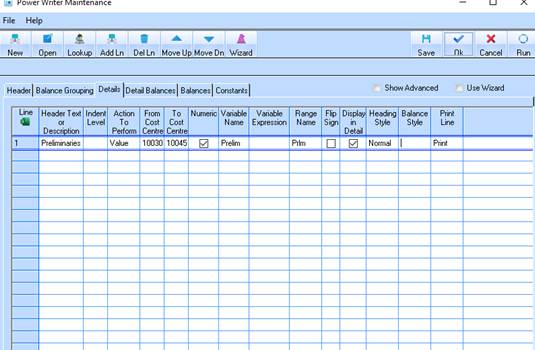
20. Press the Details tab. The following window will be displayed:
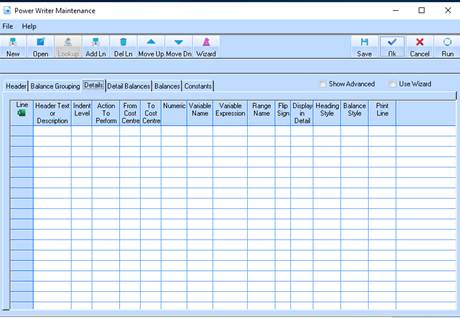
21. From this window, select the Add Line button.
22. To create the Details line items, select the Wizard button. The following window will be displayed:
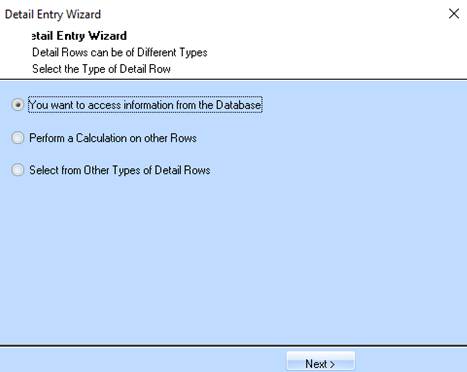
23. The system
will default to the selection of the You want to access information from the
Database radio button  . Press the Next button. The following
window will be displayed:
. Press the Next button. The following
window will be displayed:
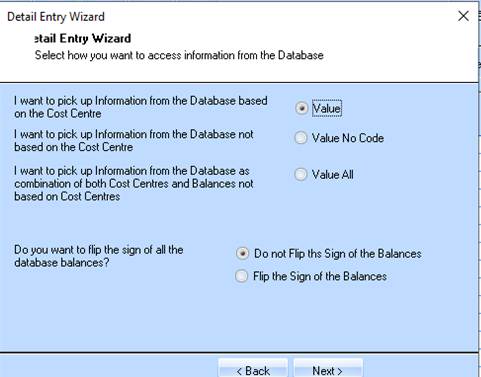
24. The report we are creating will give us basic cost information. We want to pick up distribution codes from the database that reflect this cost information. For you to create reports from you database, you will have to be familiar with your database. The following is just an example of the process of creating a Detail Row in the report.
25. There are several types of Detail lines we can enter into the report. For basic reports, the following types of data are used:
|
Code |
Description |
|
Value |
Allows you to choose data directly from a distribution code. |
|
Value No Code |
Chooses data not related to a distribution code. |
|
Value All |
Chooses data that is both related to distribution codes and not related to distribution codes |
|
Text Only |
Allows you to enter a text only heading, for formatting purposes |
|
Use Variable |
Allows you to create a Variable expression based on detail rows already created in the report from distribution codes |
|
New Page |
Creates a New Page at this detail row in the report |
|
Subroutine |
Allows you to run an entirely different report’s details rows at this point |
26. The system will default the Value radio button as selected. Leave the value as defaulted.
27. Select the
Do not Flip the Sign of the Balances radio button
28. Press the Next button. The following window will be displayed:
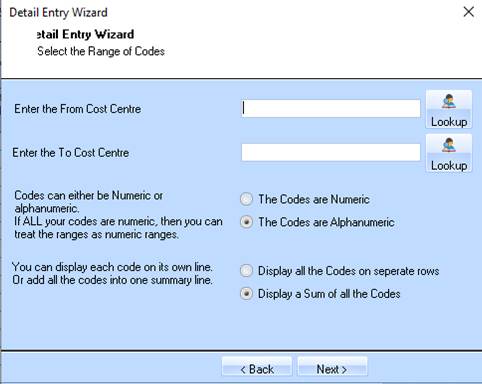
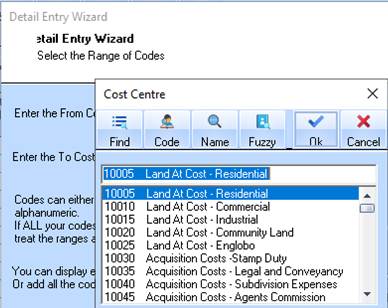
29. Click in the Enter the From Distribution/Class code box, and enter the values you would like to appear in the report. If you do not know the distribution code, click on the Lookup button, and choose it from the list. The following window will be displayed:
30. For this example we will use distribution code 10030
31. Click in the Enter the To Distribution/Class code text box and type the ending distribution class code. If you do not know the class code, click on the Lookup button. The following window will be displayed:
32. For this example we will use the distribution code 10130
33. The database has been setup to reflect all preliminary cost codes between 10130 and 10045. Therefore, for this detail line of the report, we will call this detail line Preliminaries.
34. Click on the Codes are Numeric radio button. This allows the distribution codes to be sorted accurately.
35. You also have a choice as to how the detail of the report is generated. You can specify that each individual distribution code has a line of its own in the spreadsheet, or that all the numbers between these two distribution codes are summed.
36. For the
purposes of this report, we will display one distribution code per spreadsheet
line. To do this select the Display all the codes on separate rows radio button
.
37. Press the Next button. The following window will be displayed:
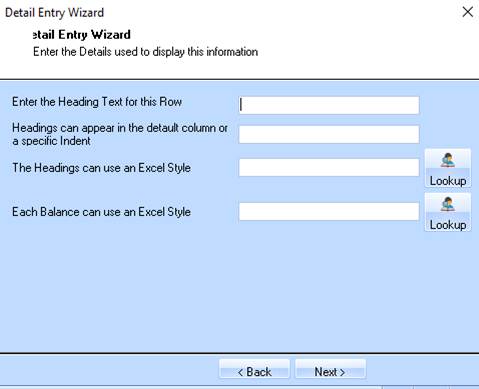
38. We want all of the Distribution codes to be output on the left hand side of the spreadsheet. Type a 1 in the Headings can appear in the default column or a specific Indent. Press Tab.
39. The Headings can use an Excel Style field is used to explain the data. These can be formatted to specific Excel styles. The Balances are the numbers (usually dollars) that are extracted from the database. Therefore it would be appropriate to choose a Currency format for the Balance style. Select the Lookup button and select a balance style from the list.
40. Press the Next button. The following window will be displayed:
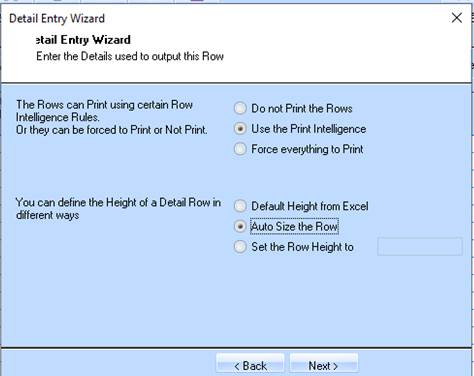
41. Ensure the
Use the Print Intelligence radio button is selected. This will determine if a
value is empty. If it is empty, Power Writer will not output that value,
conserving room on your spreadsheet
42. Select the
Auto Size the Row radio button . This will ensure no data is obscured by a
row that is not big enough to display the data
43. Press the Next button. The following window will be displayed:
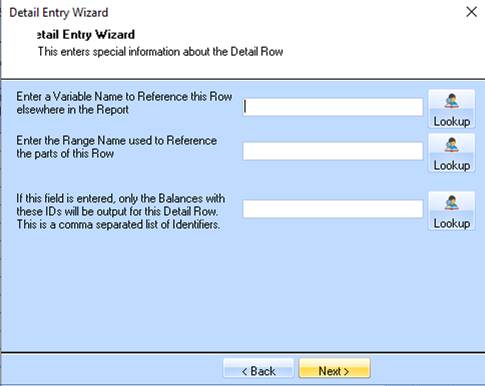
44. In the Enter a Variable Name to Reference this Row elsewhere in the Report field, enter a value of “PRELIM”. This allows this data to be referenced at other places in the report
45. In the Enter the Range Name used to Reference the parts of this Row field, enter a value of “PRLM”. This instructs Excel to create a range name for the preliminaries distribution codes. This range name can be used at a later point to reference these values from Excel
46. Leave the If this field is entered, only the Balances with these ID’s will be output to this Detail Row. This is a comma separated list of identifiers blank and press the Next button. The following window will be displayed:
47. In the Enter the description for this row field specify a name of “Preliminaries”. Select the Next button. The following window will be displayed:
48. Select the Finish button. The populated Power Writer Details window will be displayed as follows: